What are the current trends with infographics in 2014?
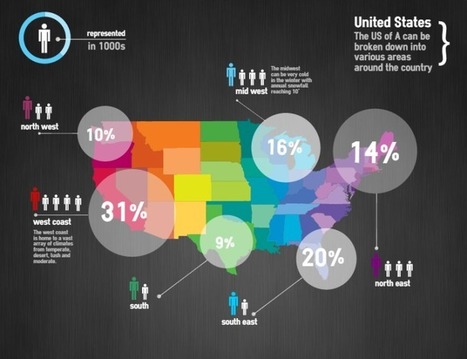
Infographics have always been around, but the emergence of “Big Data” has caused the display of trends and statistical correlations using “little men” and 3-D pie charts to become more popular than ever. Why? As a society we’ve become inundated with piles of alphanumeric data each day.
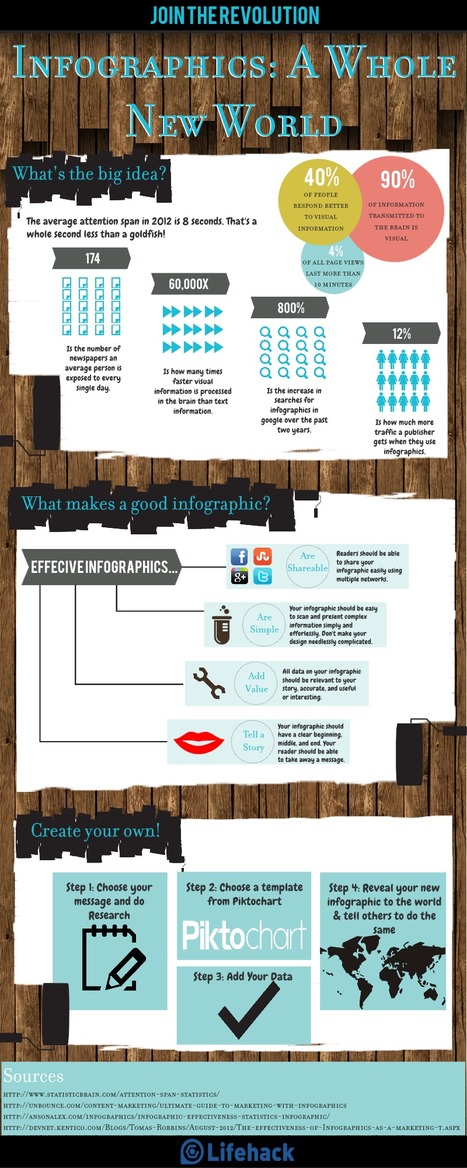
Infographics takes this content and boils it down to essential, understandable visual elements. Additionally, as a content building/content marketing tactic, infographics can provide a break from “dry text,” causing users to spend more time on the page. But as the novelty of infographics has faded, more and more bad infographics saturate the web landscape.
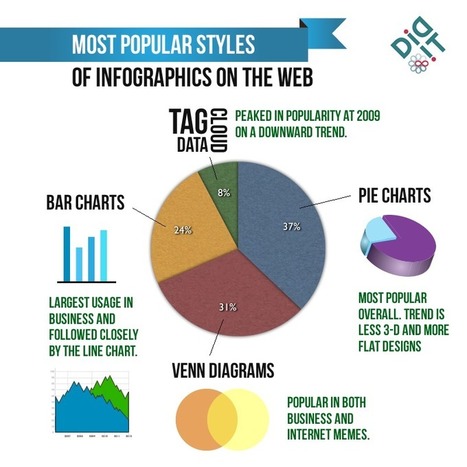
In order for infographics to be effective, they need to use multiple data points to tell a cohesive story or prove a theory. After some research, I found some interesting trends affecting the infographics space....
Via
Jeff Domansky


 Your new post is loading...


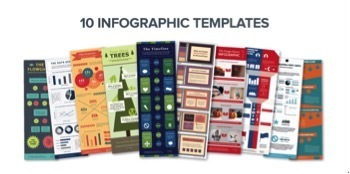


![How to Create an Infographic in Under an Hour [+10 Free Templates] | digital marketing strategy | Scoop.it](https://img.scoop.it/jKldflV4zNqvqJirZoFfwTl72eJkfbmt4t8yenImKBVvK0kTmF0xjctABnaLJIm9)


I selected this article from Curatti written by Susan Gilbert because it helps you improve your visual marketing with shareable infographics.
Visual graphics can be both fun and informative for your niche audience.
Create Infographics That Grow Your Following Online
People are drawn to appealing content that grabs their attention right away. I agree that infographics can help attract more subscribers and followers.
Gilbert shows you how to create graphics that audiences are more willing to share.
Here's what caught my attention:
Selected by Jan Gordon for Curatti covering Curation, Social Business and Beyond
Featured image: 123rf.
Read full article here: http://ow.ly/x9eO30aBqyw
Stay informed on trends, insights, what's happening in the digital world become a Curatti Insider today