
Infographics are, simply put, visual representations of data. They serve the purpose of clarifying and communicating complex ideas through a widely accessible
Get Started for FREE
Sign up with Facebook Sign up with X
I don't have a Facebook or a X account


 Your new post is loading...
 Your new post is loading...
Your new post is loading...
Infographics are, simply put, visual representations of data. They serve the purpose of clarifying and communicating complex ideas through a widely accessible 
No comment yet.
Sign up to comment
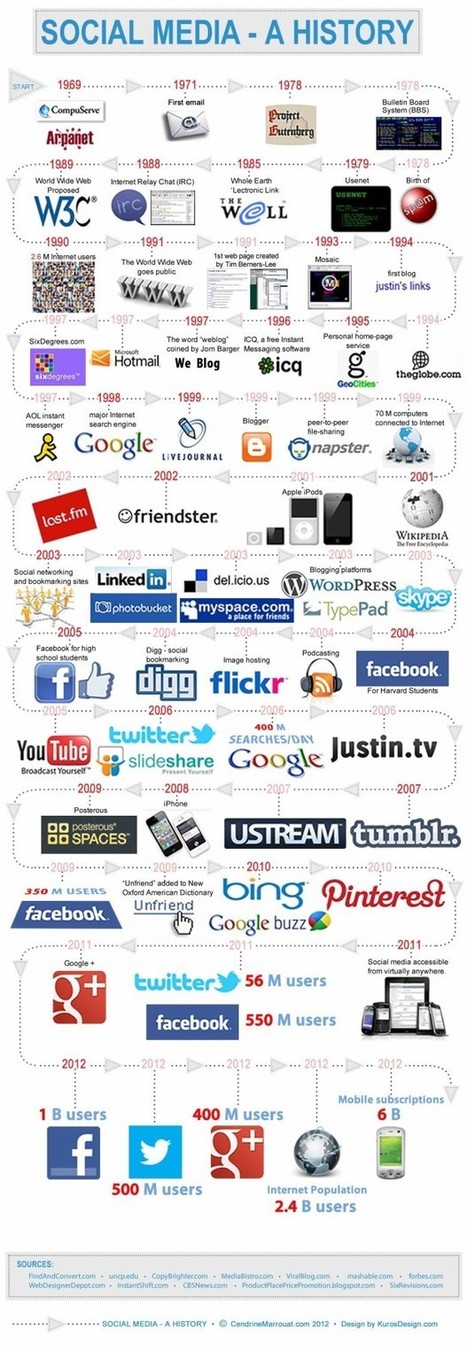
Do you know the history of social media? Think we'll remember Facebook in 20 years? This detailed timeline is a must-see.
Social media began decades before the Facebook era. It started, more or less, with CompuServe and Arpanet back in 1969. A couple years later, the first-ever email was sent. It has evolved over the past few decades into a powerful tool, as seen in this social media history timeline. With so much that’s happened over the past few decades, we can only guess what’s coming next for social media. Via Lauren Moss, Deborah Arnold

Charles Rein's comment,
July 24, 2013 3:38 PM
From the land of "Wired Telephones" USA, we can now look at how explosive Global growth and the potential 5-7 billion people who will always use a Smart or Cell device
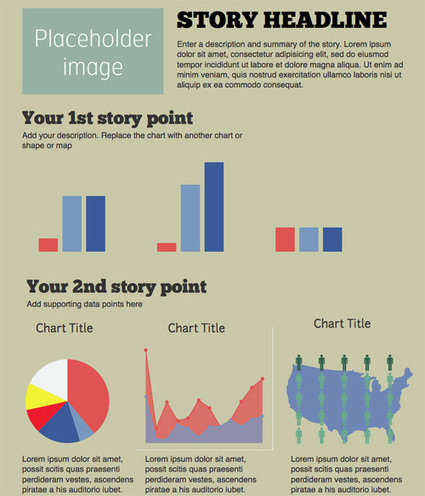
While not everyone can make infographics from scratch, there are tools available on the Web that will help you create your very own infographics. In this article, we’re listing more than 20 such options to help you get your messages across to your readers, visually. Via Let's Learn IT, Robin Good, Lauren Moss

Two Pens's curator insight,
May 13, 2013 1:14 PM
Piktochart is easy to work with and creates a fair Infographic. I still prefer to hire an art director. It's worth the money to have an intelligent designer with you :-) 
Eddie Thornton's curator insight,
May 13, 2013 3:29 PM
Don't forget to add your perspecitve, your insight as to why this infographic add up to more than just numbers and figures on a chart. 
Ness Crouch's curator insight,
May 14, 2013 4:09 PM
Another great link to help create infographics. I'd like to get more time to create these for class...

Beth Kanter
Another way to articulate the importance of sense-making.
Think about it this way: Tools are not always actual objects designed to help us with physical activities. A notebook, whether it is a Moleskine or an Evernote digital document, is a tool that expands our memory. A digital calculator, whether it is an inexpensive machine bought in the nearest Dollar Tree or an app downloaded to your iPhone, frees you from the burden of having to retain and execute many complex mathematical algorithms. Non-physical tools (or sets of tools and practices), such as statistics and the scientific method, evolved to let us gaze beyond what we would normally see, and to overcome our deepest biases and lazy habits of mind. The same is true for great visual displays of information... Via Lauren Moss
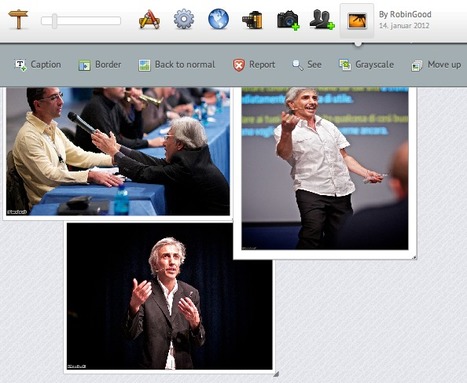
CanvasDropr provides a virtually infinite online canvas on which you and your friends / contacts can easily add, position, resize and rotate photos and video clips at will.
From the official site: "The center of the CanvasDropr idea is to work and collaborate on a so-called "Canvas".
The canvas can be shared by an unlimited amount of people, and changes made in the canvas are updated real-time in every user’s canvas.
Users can easily drag and drop new images directly from their desktop onto the canvas."
CanvasDrops allows you to text chat in real-time with other "collaborators" you have invited as well as to set permissions for what "public" users can edit or modify on a "public canvas.
It is possible to place photos and video clips coming from Facebook, YouTube, Flickr and Picasa or to import one simply by providing its URL.
The final canvas can be shared on FB or Twitter, downloaded as an "image" or a .zip file containing all of its images and can also be "embedded" on any site or blog.
The service is free to use.
Check this video: http://vimeo.com/31591478
or you can try it immediately with no need for signup if you alrady have a Twitter or facebook account: http://www.canvasdropr.com/Signup.aspx Via Robin Good

Louise Robinson-Lay's curator insight,
January 10, 2013 6:44 PM
A nice collaborative tool for images. |

Data visualization is an amazing tool. The data we deal with daily would be almost entirely inaccessible when locked up in numerical formats. Luckily, data visualization can help us to extract information, insights, or even knowledge from that data. It relies on the remarkable human visual system that turns visible light into meaningful semantics that inform our decisions.
More details on the human visual system, visual metaphors, visual context, exploration and presentation at the article link. Via Lauren Moss

Gordon Shupe's curator insight,
November 18, 2013 9:53 AM
Excellent overview - this is a resource to save and use!
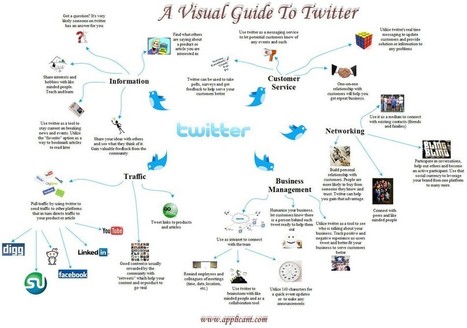
This infographic provides a visual guide and a brief synopsis of different uses for Twitter. It includes information about how Twitter can be used as a tool for information, customer service, networking, business management and website management. Via Lauren Moss
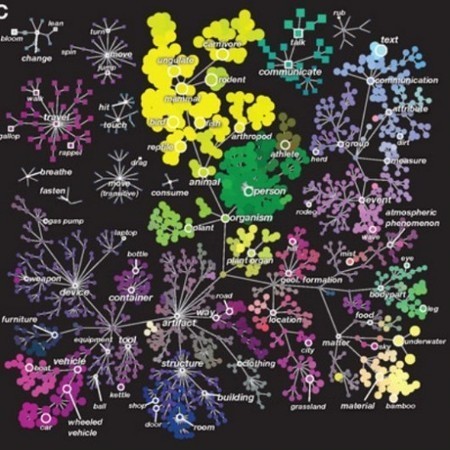
How does our brain organize the visual information that our eyes capture? Researchers at the University of California, Berkeley, used computational models of brain imaging data to answer this question and arrived at what they call “continuous semantic space” – a notion which serves as the basis for the first interactive maps showing how the brain categorizes what we see.The data on which the maps are based was collected while the subjects watched movie clips. Brain activity was recorded via functional Magnetic Resonance Imaging (fMRI), a type of MRI that measures brain activity by detecting related changes in blood flow. In order to find the correlations in the data collected, the researchers used a type of analysis known as regularized linear regression... Via Lauren Moss, Beth Kanter

Pedro Barbosa's curator insight,
December 28, 2012 7:53 AM
Excellent articple about neuroscience - visual mapping. Understanding our minds is important on all types of management tasks;)
Pedro Barbosa | www.pbarbosa.com | www.harvardtrends.com 
Beth Kanter's curator insight,
December 30, 2012 4:10 PM
Good points to make about why going visual is important
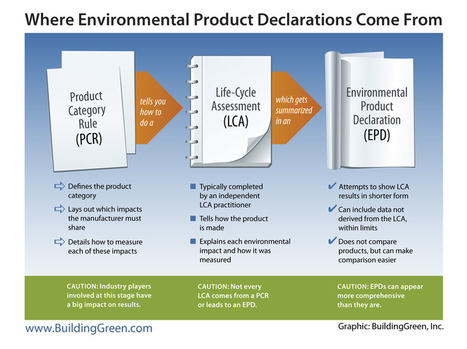
Visually-compelling content can take many forms, from creatively produced videos to engaging Facebook photos. Today, we thought we would give a quick course in one of the the highest forms of visually powerful content: Infographics. Mashable defines infographics as graphic visual representations of information, data or knowledge used to present complex information quickly and clearly. Infographics are becoming more common in the building industry, particularly on websites and blogs catering to architects and designers. The best infographics try to articulate one of five key communications challenges. Read the complete article for an example of each of these challenges in action on popular industry websites... Via Lauren Moss

Visual brainstorming is about collaboratively-generating ideas, without using the spoken or written word. You might use objects, which teams put together to solve problems. You might use arts and crafts materials, such as colored construction paper, tape, string, card, pens, and the like. You might use people to create improvisational role-plays. Visual brainstorming need not be limited to physical objects, such as new products. You may also use it to brainstorm processes, services, and activities. All you need is a little imagination and the ability to visualize problems. Via Lauren Moss
|