Information Technology & Social Media News
131.0K views | +0 today
Follow
Information Technology & Social Media News
Mobile Marketing and Technology are my passions.... those are the ones I can confess ;-)
Your new post is loading...
Rescooped by Jesús Hernández from visualizing social media
Scoop.it!

Internet Consumption Around the World

Internet Consumption Around the World | Information Technology & Social Media News | Scoop.it

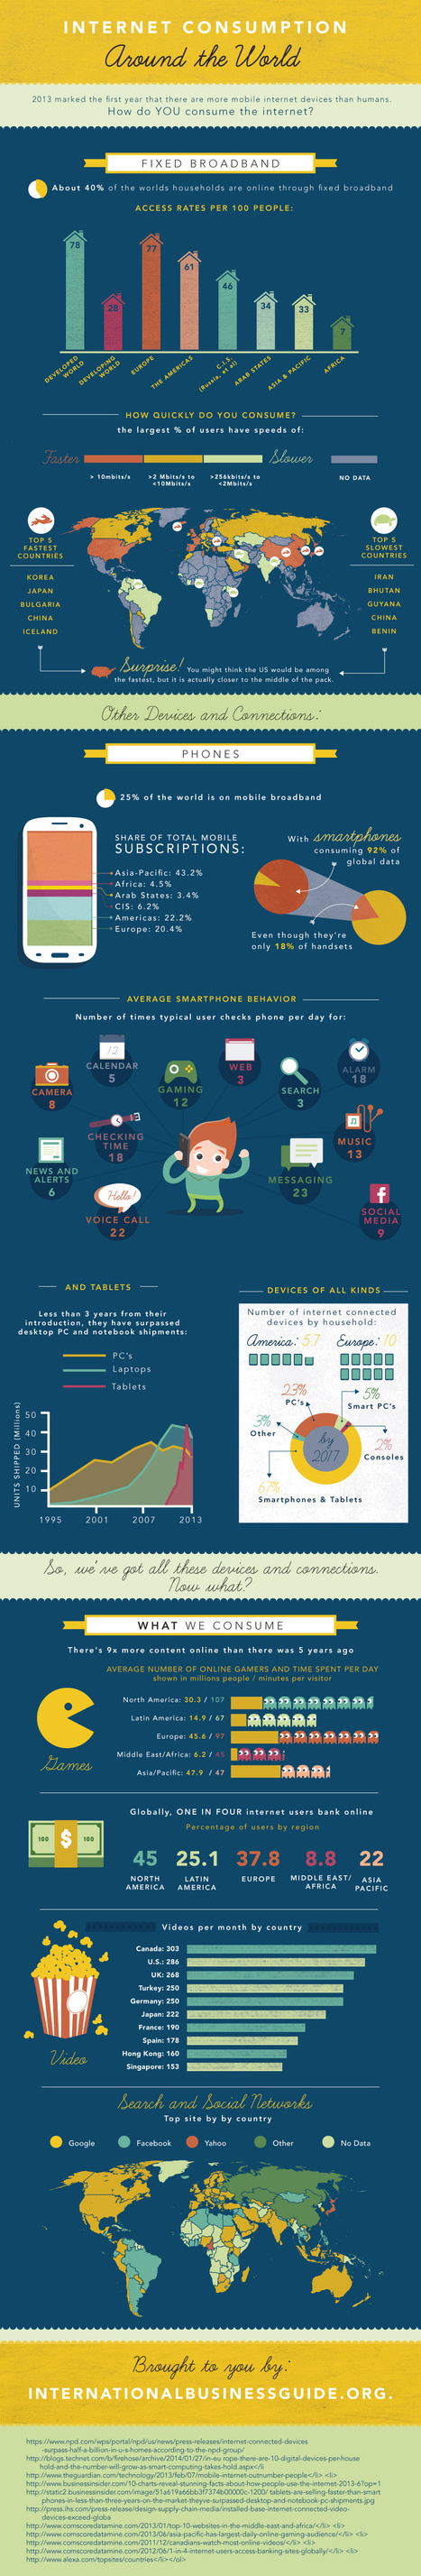
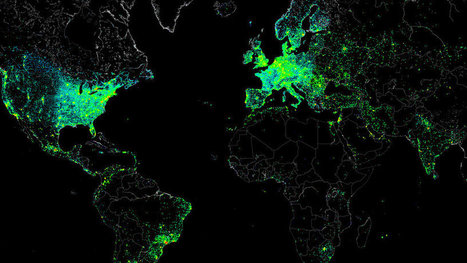
¿Qué hace la gente en línea en el mundo de hoy, ¿cómo obtienen en línea, y en lo que acelera? Un nuevo informe de la Guía Internacional de Empresas muestra cómo cómo millones de personas en el mundo acceden a la internet, donde el internet es el más rápido, y los dispositivos con los que se conectan, tras el primer año, cuando hay dispositivos de Internet móviles más que los humanos.

Ver esta infografía para ver qué regiones lideran el mundo en términos de las tasas de acceso a Internet, que consume lo que en línea y los sitios web más populares de la región.


Via Lauren Moss
Arnaud d'Haen's curator insight, April 3, 2014 6:13 AM

You're consuming... right now!

Smith_Lin's curator insight, April 3, 2014 9:24 AM

This has to be useful on all sorts of levels

Ariel Harosh's curator insight, April 4, 2014 11:51 AM

השימוש באינטרנט ברחבי העולם נתונים מדהימים

Rescooped by Jesús Hernández from visualizing social media
Scoop.it!

Infographic: A Day in the Life of Web Content

Infographic: A Day in the Life of Web Content | Information Technology & Social Media News | Scoop.it
Did you know that there are 92K plus articles posted on the internet with 1.19 Billion+ engaged minutes every single day? In other words, 1,194,902,462 engaged minutes is roughly 10 seconds per every person on earth or 2273 years of time.

Via Lauren Moss
Lori Wilk's curator insight, December 19, 2013 11:28 AM

It is amazing how much content is placed on the Internet every minute

Ray Beauchamp's curator insight, December 28, 2013 4:24 PM

Did you know that there are 92K plus articles posted on the internet with 1.19 Billion+ engaged minutes every single day? In other words, 1,194,902,462 engaged minutes is roughly 10 seconds per every person on earth or 2273 years of time.

Nine0Media's curator insight, February 1, 2014 11:32 AM

#Wordpress #WebConsultants #NIne0Media

Rescooped by Jesús Hernández from Future of Cloud Computing, IoT and Software Market
Scoop.it!

Infographic: The Incredible Growth of Web Usage [1984-2013]

Infographic: The Incredible Growth of Web Usage [1984-2013] | Information Technology & Social Media News | Scoop.it

In the three decades since the Internet evolved from an experimental band of academic and government computer systems into a globe-spanning network of interconnected systems, the amount of time spent online has grown to rival (or even exceed) the time spent living offline. Personal computers, tablets and smartphones have made the connected life a reality, and the number of folks pursuing it has exploded.


Find more details at the link.


Via Lauren Moss, Francois Trouillet, Philippe Trebaul, massimo facchinetti
Andrew Earnshaw's curator insight, September 20, 2013 3:23 PM

Yes, I too can remember when there wasn't an Internet. Is there an application that's not yet been produced. What next will we all wonder how we did without ?

Al Marqz's curator insight, September 27, 2013 7:14 PM

La humanidad en bloque ha optado por la gran Red y de ésta, por las redes sociales... ¡Larga vida a la web!

Pallab Kakoti's curator insight, April 16, 2014 7:44 AM

The rise & rise of web usage is one of the most unifying & reformative development to have impacted on a global scale. An insightful info-graphic that offers a unique purview from the inception days of internet to the latest trend of app usage estimating an annual revenue of $24 billion.


A pure delight that's not to be missed #PlbKkt for #hshdsh via #blogs4bytes //

Rescooped by Jesús Hernández from Mastering Facebook, Google+, Twitter
Scoop.it!

The Second Screen Phenomena – Infographic

The Second Screen Phenomena – Infographic | Information Technology & Social Media News | Scoop.it

Second screen viewing, which refers to using an additional electronic device while watching television, is a widespread consumer behavior that has quickly become the norm.


In an attempt to better understand this trend, Viaccess-Orca has analyzed second screen usage amongst diverse populations of television viewers. The results, which appear in this infographic, demonstrate the extent to which second screen viewing is altering the TV industry. According to our data, 70% of tablet owners, and 68% of smartphone owners, state that they use their additional devices while watching TV.

However, only 37% of those who practice second screen viewing do so in order to look up information that is related to the program they are watching. Most TV viewers use their devices in order to check emails or visit a social network...


Via Lauren Moss, Jose Maria Hernandez Montes, massimo facchinetti
Rescooped by Jesús Hernández from visualizing social media
Scoop.it!

A Day in the Life of the Modern Smartphone User [Infographic]

A Day in the Life of the Modern Smartphone User [Infographic] | Information Technology & Social Media News | Scoop.it

Data and information from Citrix about mobile trends shows us we’re not the only ones growing increasingly attached to our mobile devices.

Whether it’s a personal, social or business setting, people are using their smartphones in more places and ways than ever before and the increasing speed of smartphones encourages us to rely on them more often. As the data here shows, we share more phone habits than we might have thought.


Via Lauren Moss
Julia Sokolova's curator insight, March 31, 2014 4:54 AM

Social media is made up of 63% images and 32% videos 


50% of mobile ads are served to 50% of smartphone users 


1/2 of the top health apps are fitness apps, which require more data to track a user's status


1.5% of a user's mobile data usage comes from network-connected gaming 


57% of people blame the mobile operator when a video stalls 

Mónica Vázquez's curator insight, April 2, 2014 2:30 PM

Las apps para fitness en aumento mientras 35% dormimos junto a nuestros celulares

Daniel Vince's curator insight, April 14, 2014 1:52 PM

Interesting Info graphic about smartphone usage.

Rescooped by Jesús Hernández from visualizing social media
Scoop.it!

Where Social Media Use is Growing the Most (Infographic)

Where Social Media Use is Growing the Most (Infographic) | Information Technology & Social Media News | Scoop.it

Every year, in every continent around the globe, more people are using social media to interact. Nearly 1 in 4 people in the world now use social networks.

By 2016, eMarketer predicts that 2.55 billion people worldwide will use social networks. Top areas of growth? India, Indonesia, Mexico, China and Brazil.

Wishpond has put together an infographic featuring data on worldwide social-network use. Check it out to find out what parts of the world are likely to see the greatest growth.


Via Lauren Moss
No comment yet.
Rescooped by Jesús Hernández from visualizing social media
Scoop.it!

Internet Users By Region – How Much Of The World Is Online? | Infographic

Internet Users By Region – How Much Of The World Is Online? | Infographic | Information Technology & Social Media News | Scoop.it
A showcase of the best infographics from around the web (Internet Users By Region – How Much Of The World Is Online?


A look at the current statistics of worldwide internet usage.


Via Lauren Moss
God Is.'s comment July 11, 2013 5:05 PM
Interesting facts. Thanks for sharing them with us...
Rescooped by Jesús Hernández from Social Media 4 Education
Scoop.it!

Infographic: Hackers Create An Amazing, Illegal Portrait Of The Internet

Infographic: Hackers Create An Amazing, Illegal Portrait Of The Internet | Information Technology & Social Media News | Scoop.it

It wasn’t malicious. The file itself was the size of a small JPEG. It was given the absolute lowest priority. And it was set to self-destruct if anything went wrong. But this small file allowed one single hacker to measure the Internet activity of nearly half a million connected devices around the world, then share the results with everyone.

How was this even possible? The "hacker" barely hacked anything. In reality, they gained access to all these systems because each had the default "root" set as a password. With this access in hand, they ran several tests focusing on Internet structure and activity. And what they created from all this data is a spectacular map that captures a day in the life of the Internet (and all of its users).


Via Lauren Moss, Ivo Nový
Annenkov's comment, May 10, 2013 11:24 PM
США и Европа как очаги информатизации
Sakis Koukouvis's comment, May 11, 2013 3:17 AM
Wonderful
Nacho Vega's curator insight, May 11, 2013 12:18 PM

Creative power: hacking at the end of the world!


Using "root" as universal key :))