#eHealthPromotion, #SaluteSocial
117.8K views | +3 today
#eHealthPromotion, #SaluteSocial
E-Health promotion. #web2salute. Health 2.0
Your new post is loading...
Scooped by Giuseppe Fattori
Scoop.it!

How I Use Scoop.it To Find Content Marketing's Over / Under - @Scenttrail

How I Use Scoop.it To Find Content Marketing's Over / Under - @Scenttrail | #eHealthPromotion, #SaluteSocial | Scoop.it

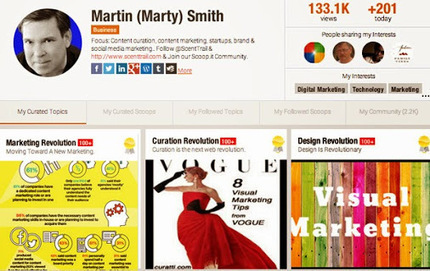
Visual Marketing Over/Under or How I Use Scoop.it
Friends like +Phil Buckley and +Mark Traphagen are curious about how and why I use Scoop.it. This G+ post shares a detailed analysis of how Scoop.it helps reduce #contentmarketing risks, provides fast feedback to influence social media marketing and creates a safe envrionment to test assumptions, create validated learning and learn fast. 
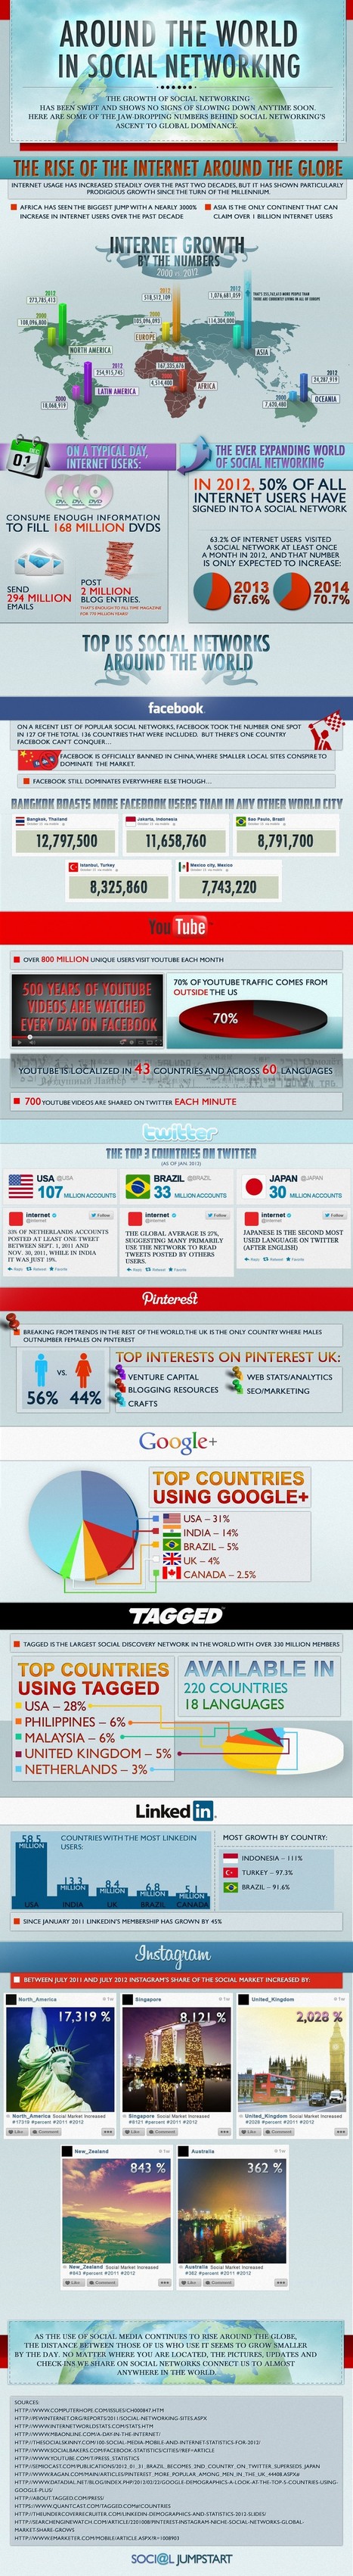
Ally Greer's curator insight, March 19, 2014 11:41 PM

We're always finding different ways to use Scoop.it, mostly coming from the intelligent community of curators that has manifested itself over the last few years.


Scoop.it Specialist @Martin (Marty) Smith wrote an explanation of how he's using Scoop.it to gauge interest in potential original content. When his posts on Scoop.it do well, he is able to see what his audience likes, and create content along the same vein.


He also explains some of the SEO benefits seen by other Scoopiteers like @Brian Yanish - MarketingHits.com.


Read Marty's post to find new creative ways to measure the potential success of content using Scoop.it and share your thoughts in the comments!

Martin (Marty) Smith's comment, March 20, 2014 12:06 AM
Thanks for the share @Ally Greer. Don't like the RISK FACTORS without @Scoop.it since each post puts modeled and valuable websites at risk. Better to test with the "fastest feedback loop in the west" :). Marty
LKGayton's curator insight, March 20, 2014 10:52 AM

Scoop.it influences social media marketing and more...

Rescooped by Giuseppe Fattori from visualizing social media
Scoop.it!

Social Media Around the World: A Complete Infographic Guide

Social Media Around the World: A Complete Infographic Guide | #eHealthPromotion, #SaluteSocial | Scoop.it

The world of social media is increasing and has a powerful role to play in the future.

In 2012, more than 63% of online users visited more number of social media websites than any other types, and that number is expected to continue going up through 2013.

View this infographic to find more statistics about online behavior and the use of Facebook, Twitter, LinkedIn, YouTube, Pinterest and Instagram across the globe...


Via Lauren Moss
Angie Mc's curator insight, January 26, 2014 10:13 AM

Making friends worldwide is one of the best parts of participating in social media.  I especially love how Twitter makes it easy to connect across time zones.

Lydia Gracia's curator insight, February 14, 2014 5:20 AM

La Guia completa del Social Media en el Mundo

Professor Jill Jameson's curator insight, March 4, 2014 10:52 AM

Astonishing figures! 

Rescooped by Giuseppe Fattori from visualizing social media
Scoop.it!

How to Improve Google Page Quality Scores

How to Improve Google Page Quality Scores | #eHealthPromotion, #SaluteSocial | Scoop.it
How to Improve Google Adwords Quality Scores...

Google always wants to make sure that the most qualified pages are showing up in their queries. This makes sure that users get the most relevant sites regarding content, combined with the best navigation and ease of use. Its quality score is an estimation of how relevant your landing page, keywords, and ads are to the keyword you’re targeting. It also relates to the people viewing your content, where your ad will be located on the page, and how much Google is going to charge you for your ad location.
...


Via Lauren Moss
No comment yet.
Rescooped by Giuseppe Fattori from visualizing social media
Scoop.it!

Infographic: The history of online advertising

Infographic: The history of online advertising | #eHealthPromotion, #SaluteSocial | Scoop.it

Advertising has come a long way since the first ever online ad was sold in 1993.

This new infographic from Marin Software plots the industry's biggest moments, from the launch of Facebook to Twitter's promotional tweets and the more recent introduction of Google Adwords.


Via Lauren Moss
9Dotstrategies's curator insight, October 3, 2013 4:24 AM

History of Online Advertising: An Infographic

Jagadish Pokhrel's curator insight, October 4, 2013 12:54 AM

what's up next?

Lee Werrell's curator insight, October 6, 2013 6:47 AM

Just shows the phenomenal growth of online activity - and it is set to grow exponentially as more peoiple access the internet.

Rescooped by Giuseppe Fattori from visualizing social media
Scoop.it!

Take A Look At What Happens Every Single Minute On The Internet

Take A Look At What Happens Every Single Minute On The Internet | #eHealthPromotion, #SaluteSocial | Scoop.it
Early last year we learned that one hour of YouTube is uploaded every second. It was a bracing reminder of just how many people are spending their time online simultaneously.


Created by rewards site Qmee, the infographic "Online In 60 Seconds" is a pie chart that shows off the sheer amount of online activity that takes place every single minute. The amount of YouTube videos uploaded has already increased from January 2012's 60 hours per minute to 72. Additionally, over 1.8 million things are liked on Facebook, and 278 thousand bon mots tweeted. Not depicted in the chart: the amount of work that is going undone while all of these items are being viewed.


Via Lauren Moss
Sois Islam's comment, August 25, 2013 12:39 AM
hello, thnxz for viewing !
Sois Islam's comment, August 25, 2013 12:39 AM
Dear Mr. Mithu thanks for the action.
Angie Thao's curator insight, May 15, 2016 7:06 PM

Single Chart Infograph:

Like: Good visual, good data.

Dislike: Can be a little overwhelming to look at.

Rescooped by Giuseppe Fattori from HEALTHCARE & SOCIAL MEDIA
Scoop.it!

10 Amazing Social Media Statistics [INFOGRAPHIC]

10 Amazing Social Media Statistics [INFOGRAPHIC] | #eHealthPromotion, #SaluteSocial | Scoop.it

Did you know that Twitter is grabbing more new registrations than Facebook, with more than half of its entire userbase compromised of people who have signed up in the last year, compared to just 19 percent for Mark Zuckerberg’s baby?

What if I said that almost a quarter (23 percent) of Facebook users check their account five or more times each day, Twitter users are 33 percent more likely to be Democrats or – sorry Foursquare – that 74 percent of Americans are unfamiliar with the concept of ‘checking in’.


These, and several other amazing social media statistics, can be found in the infographic on social media statistics...


Read more:


Via Lauren Moss, Tiago Ribeiro, Francisco Velasquez, R.Conrath, Ed.D., Gust MEES, Lionel Reichardt / le Pharmageek
LuciaSilva's comment, October 7, 2012 4:35 PM
Great post!
iPhone Developer's comment, October 12, 2012 7:51 AM
That's ow some good job
Ciberbebe.com's curator insight, July 23, 2013 4:56 AM

#socialmedia statistics